Reading your monitoring app in the first month
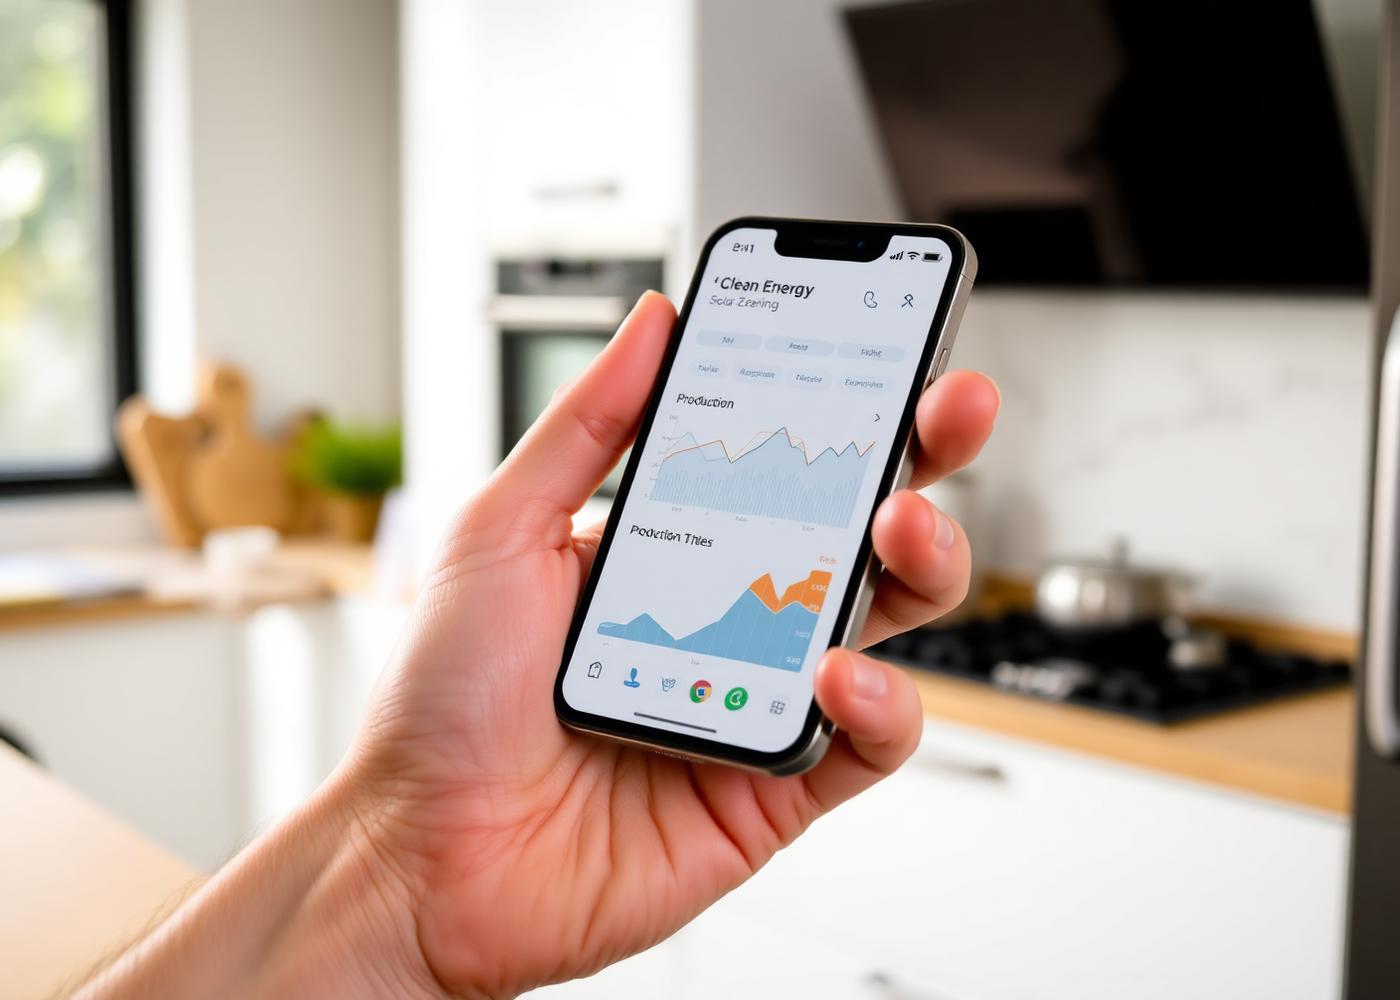
The first month after install is when your monitoring app is most useful — it is your baseline for what healthy production looks like on your roof, in your orientation, against your weather. Knowing that shape makes it obvious later if something drifts.
Expect a daily curve that peaks around the middle of the day, dips with any shading, and tracks the season. A cloudy day will cut output by 60 to 80 percent and that is normal, not a fault. What is worth raising is a string consistently underperforming its neighbours, or a sudden step-change in output that does not match the weather.
Three patterns to watch: a single string lagging the others across clear days, production that drops sharply at a fixed time each afternoon (often shading), and a battery that stops reaching full charge when solar output suggests it should. Any of those is a quick conversation with your installer.